8 Stressor-Response Library
8.1 About
The stressor-response library is designed as a public reference archive to house generalizable stressor-response functions for use in the Cumulative Effects Model for Prioritizing Recovery Actions (CEMPRA) tool. The functions archived in the stressor-response library are widely applicable to numerous applications and use cases.
Users of the CEMPRA tool can select a subset of stressor-response functions applicable to their study area and focal species of interest. Selected stressor-response functions can be used to construct a customized stressor-response input workbook for the CEMPRA tool. The stressor-response library is a valuable resource for reference as it can expedite assessments with shared knowledge of common impact pathways. Although a suite of default stressor-response functions is available, the stressor-response library will continually be updated with novel stressor-response functions uploaded, edited, and validated by the community of users.
Access the Library: Draft Stressor-Response Library
- See Sierra Sullivan and Jordan Rosenfeld for Content.
- See Matthew Bayly for login credentials to edit and upload data (info@mjbayly.com).
8.2 Stressor-Response Database
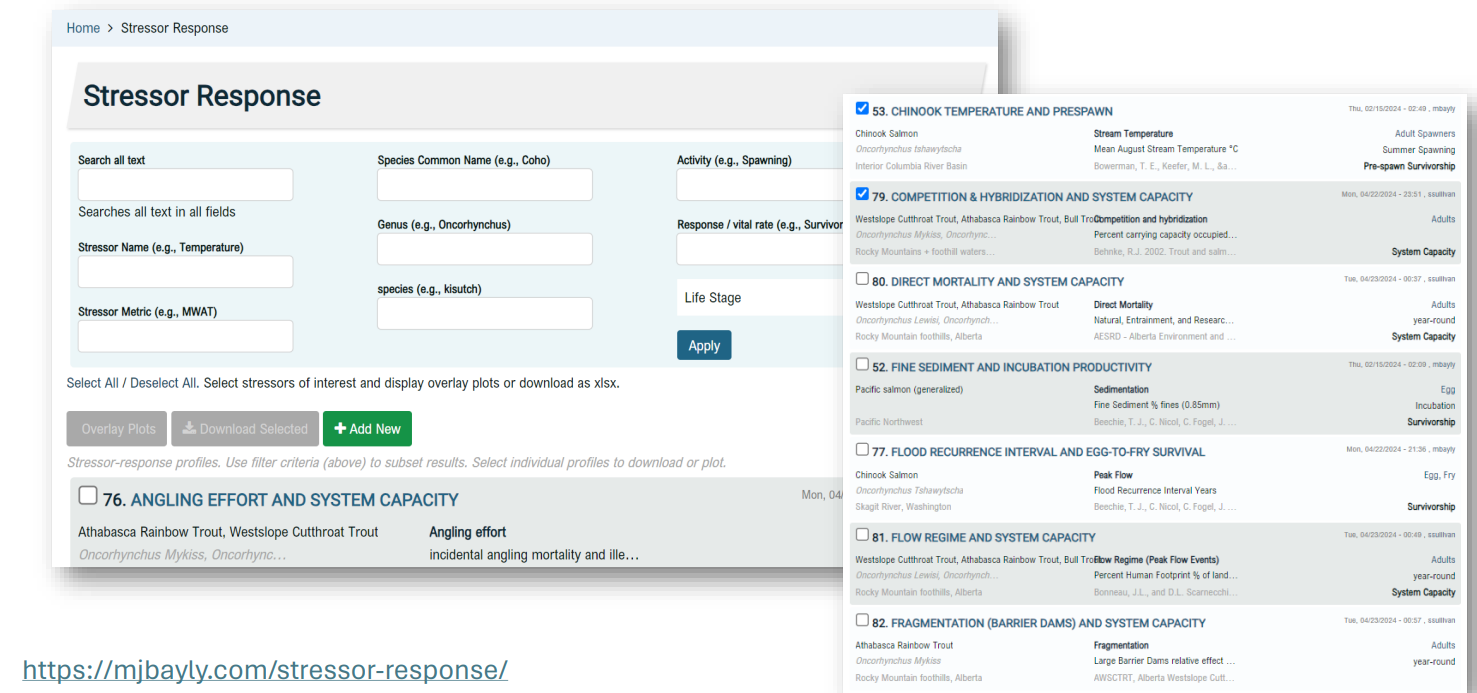
Custom filters by species, stressor, endpoint etc.
Filter library of stressor-response relationships with dynamic filters. Review stressor-response relationships and apply filters to refine search. It’s most useful to enter a term of interest in the “Search all text” input field such as “fines”, “sediment”, or “temperature”, and the click the blue “Apply” button to filter results. Scroll down the list below to review stressor-response relationships with their associated attributes (source, study area, species, life stage, reference etc.).
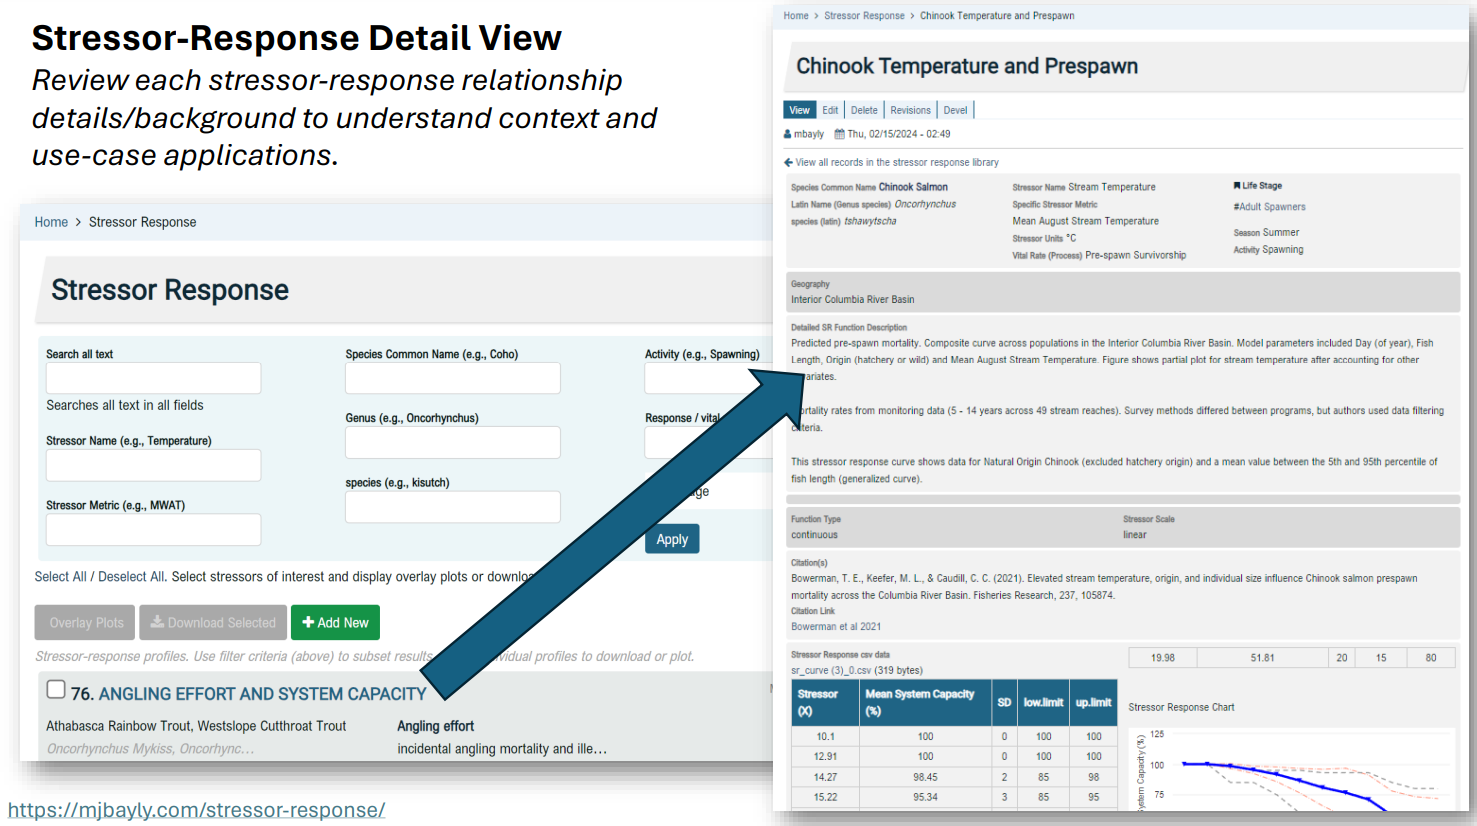
One you find a stressor-response relationship of interest, click on the stressor-response relationship from the list view to switch to detail view. The detail view of each stressor-response relationship includes descriptive details, citations, data, and all other attributes. Interactive plots are included at the bottom of the page. Some relationships are feature rich and contain descriptive background, source citations, file attachments, and other material. Other relationships are more simplified. Click the back button to return to the list view.
8.3 Create Multi-Stressor-Response Overview Plots
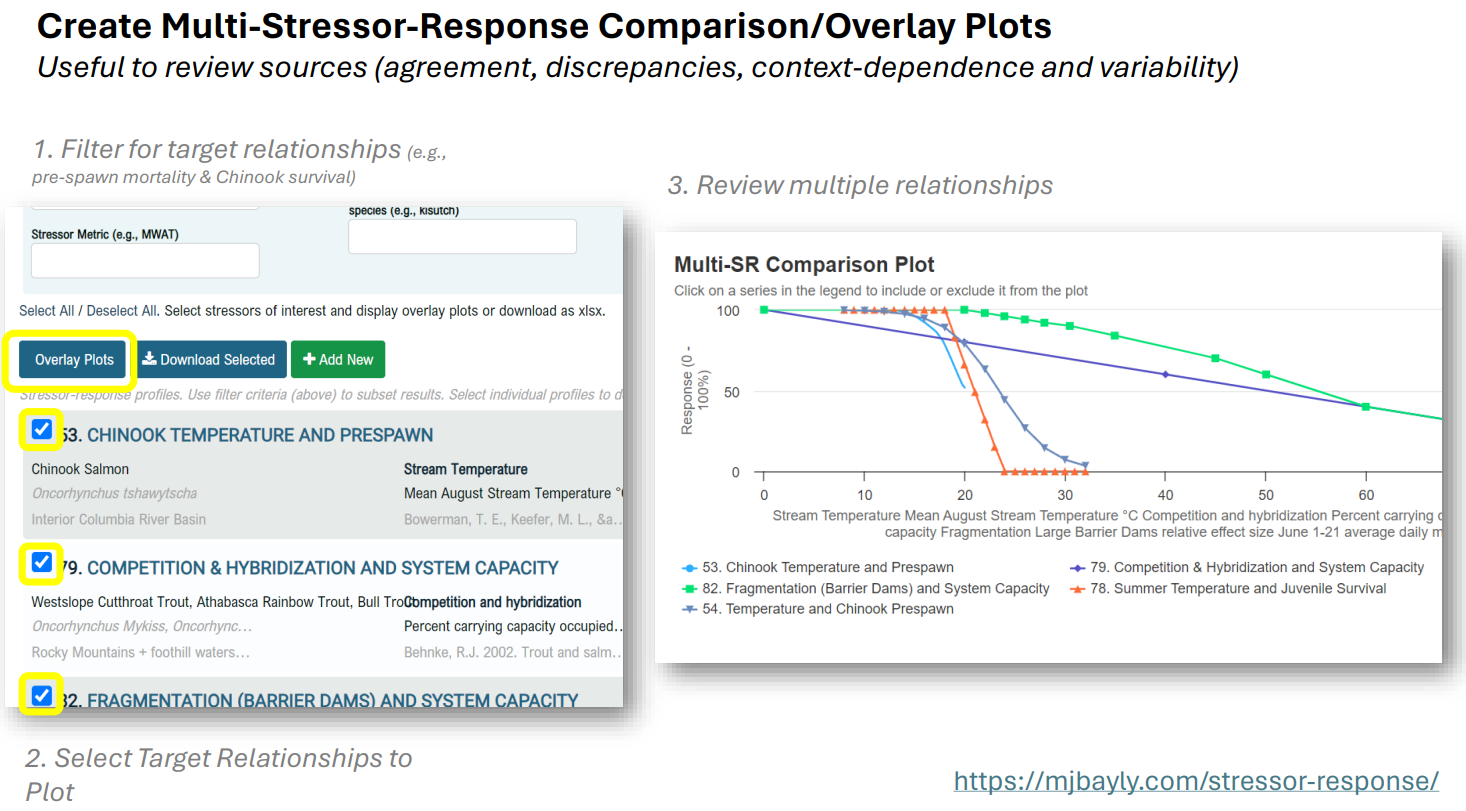
The library allows for the creation of simple multi-stressor overlay plots. These can be especially useful to compare and contrast similar stressor-response relationships across study systems or species. For example, we may wish to compare the relationship between substrate embeddedness and fry capacity across several trout and salmonids.
In the example below we will use the multi-stressor overlay plots to compare several different relationships between stream temperature and vital rates of Chinook Salmon. Be sure ensure that the stressor metric is the same (or comparable) between each resource. For example, mean August stream temperature vs MWAT etc. Select several SR relationships of interest with the checkbox select inputs and then click the “Overlay Plot” button to create plots:
8.4 Download Stressor-Response Relationships
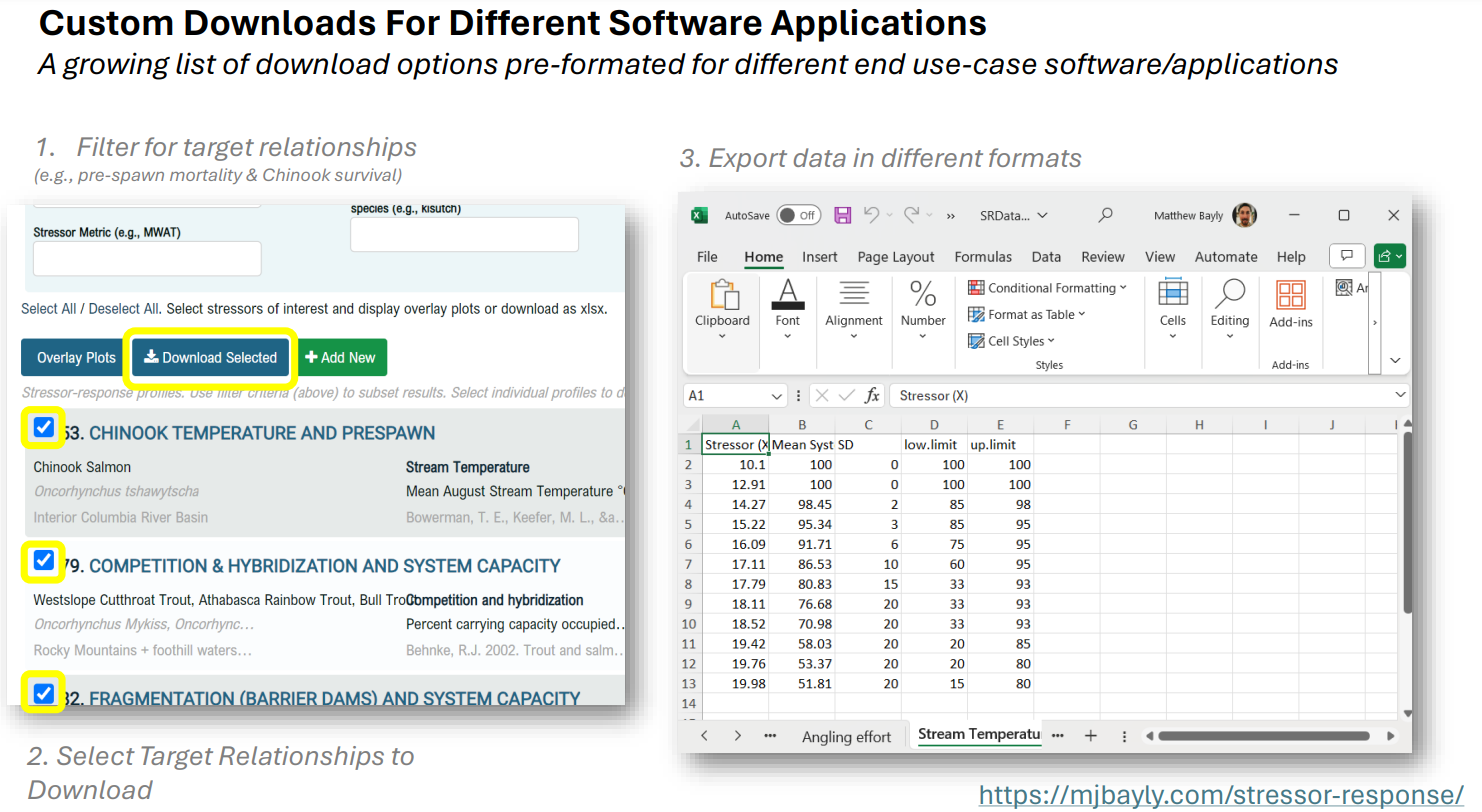
For most users the goal will be simply exporting the stressor-response relationships out of the library for use in external software and modelling excercises.
Select one or more stressor-response relationships of interest and click download. Several download formats are available including a format for the CEMPRA tool (Excel), JSON, etc. The JSON file format exports the entire database archive for selected stressors.
8.5 Add, Edit, and Update the Database
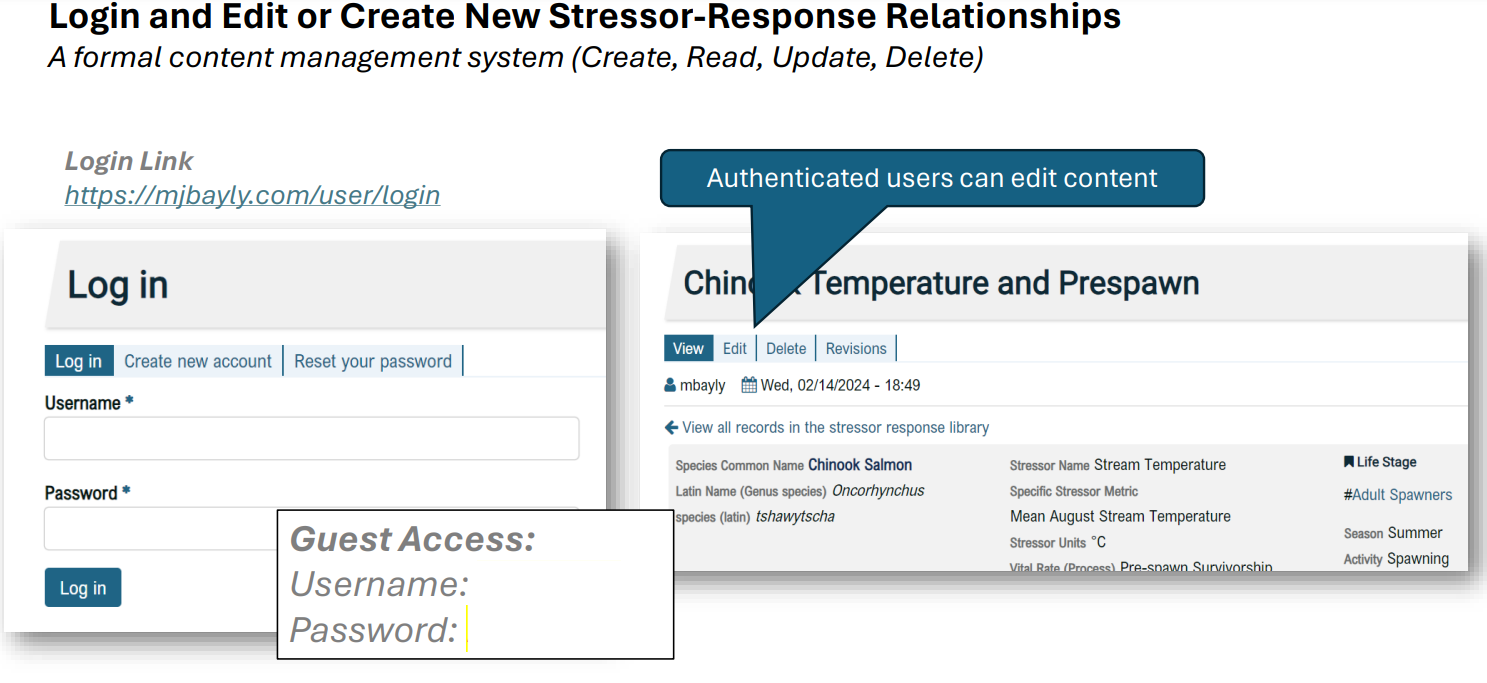
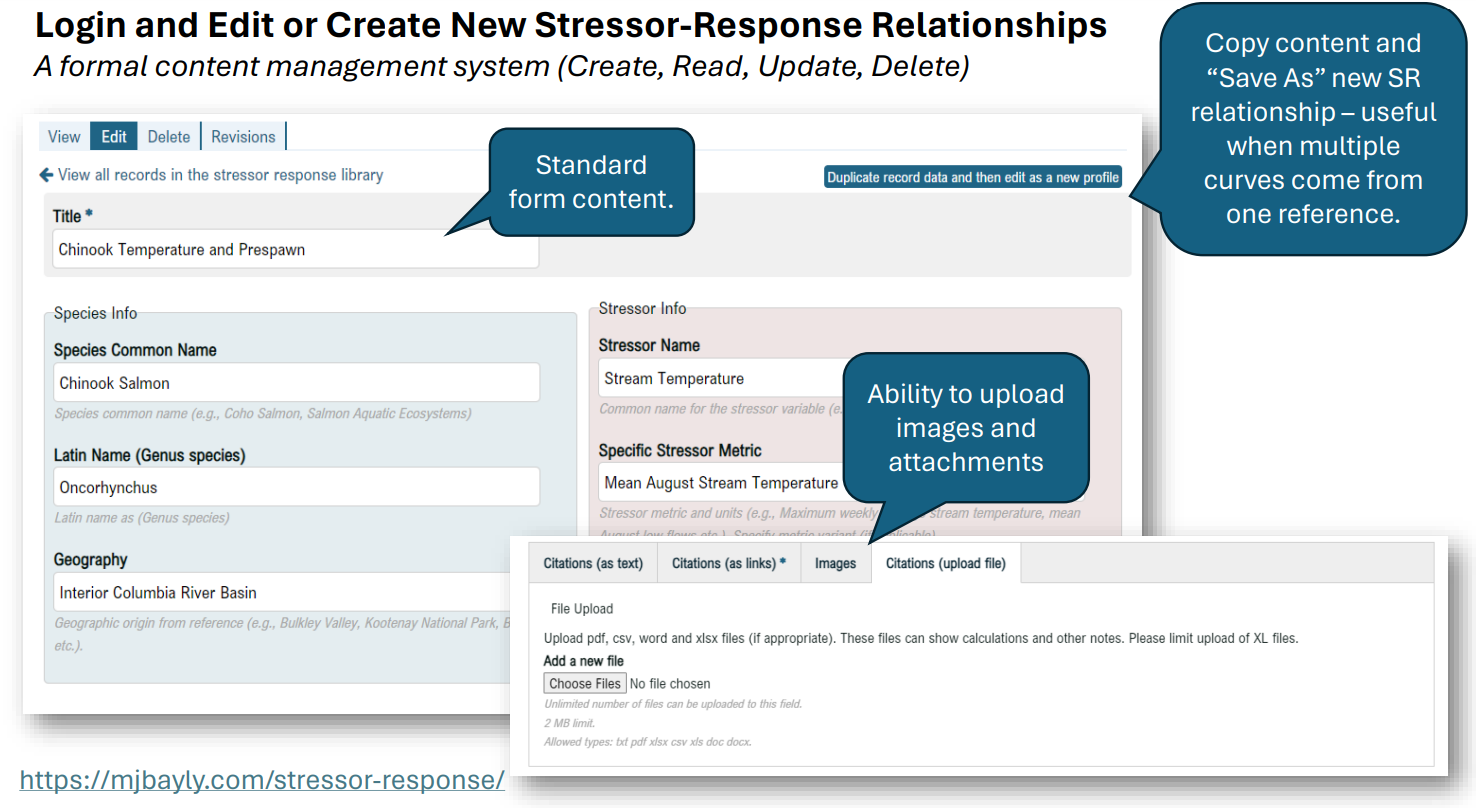
Authenticated users can login, add, edit and update relationships. Once logged in, options appear in the detail view to edit data for relationships. New stressors can be added in the detail view.
8.6 Stressor-Response Curve Tracing Tool
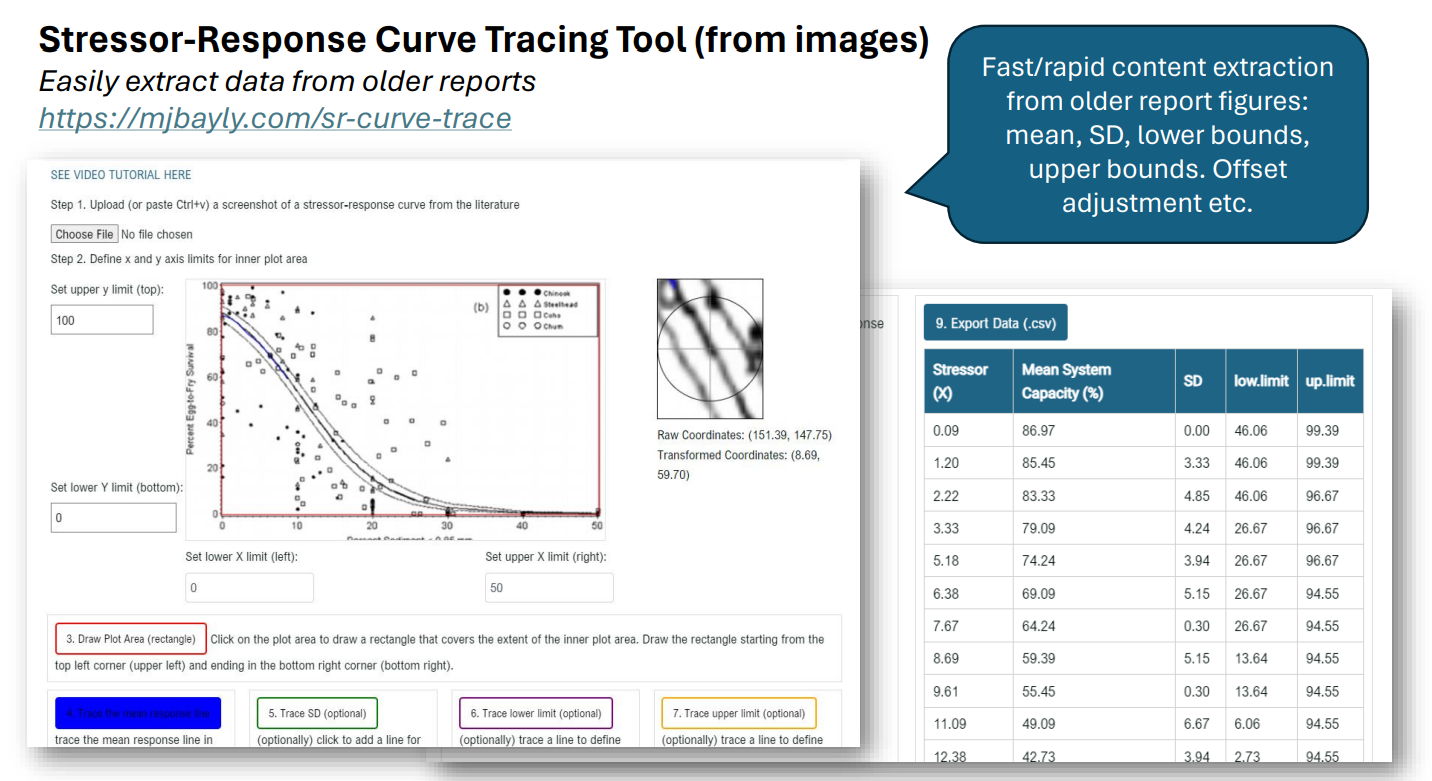
Sometimes we need to extract data in figures from older reports. This can be a tedious task, even when using software like ImageJ. A specialized online tool has been developed to upload an image (from file or clipboard), trace the mean response, sd, lower, and upper limits and extract the data in a csv file pre-formatted for the SR database and CEMPRA tool.
Access the SR curve tracing tool
(Ass the link to the video tutorial for a quick demo that describes how to use the tool).
Leave questions and comments below (via your GitHub account)
